

Looking for visitor and user insights? Open Project
Analytics in the Growth pane.
Application monitoring
Application monitoring shows how your app is behaving from your visitors’ point of view. Pick a time range at the top to zoom in or out.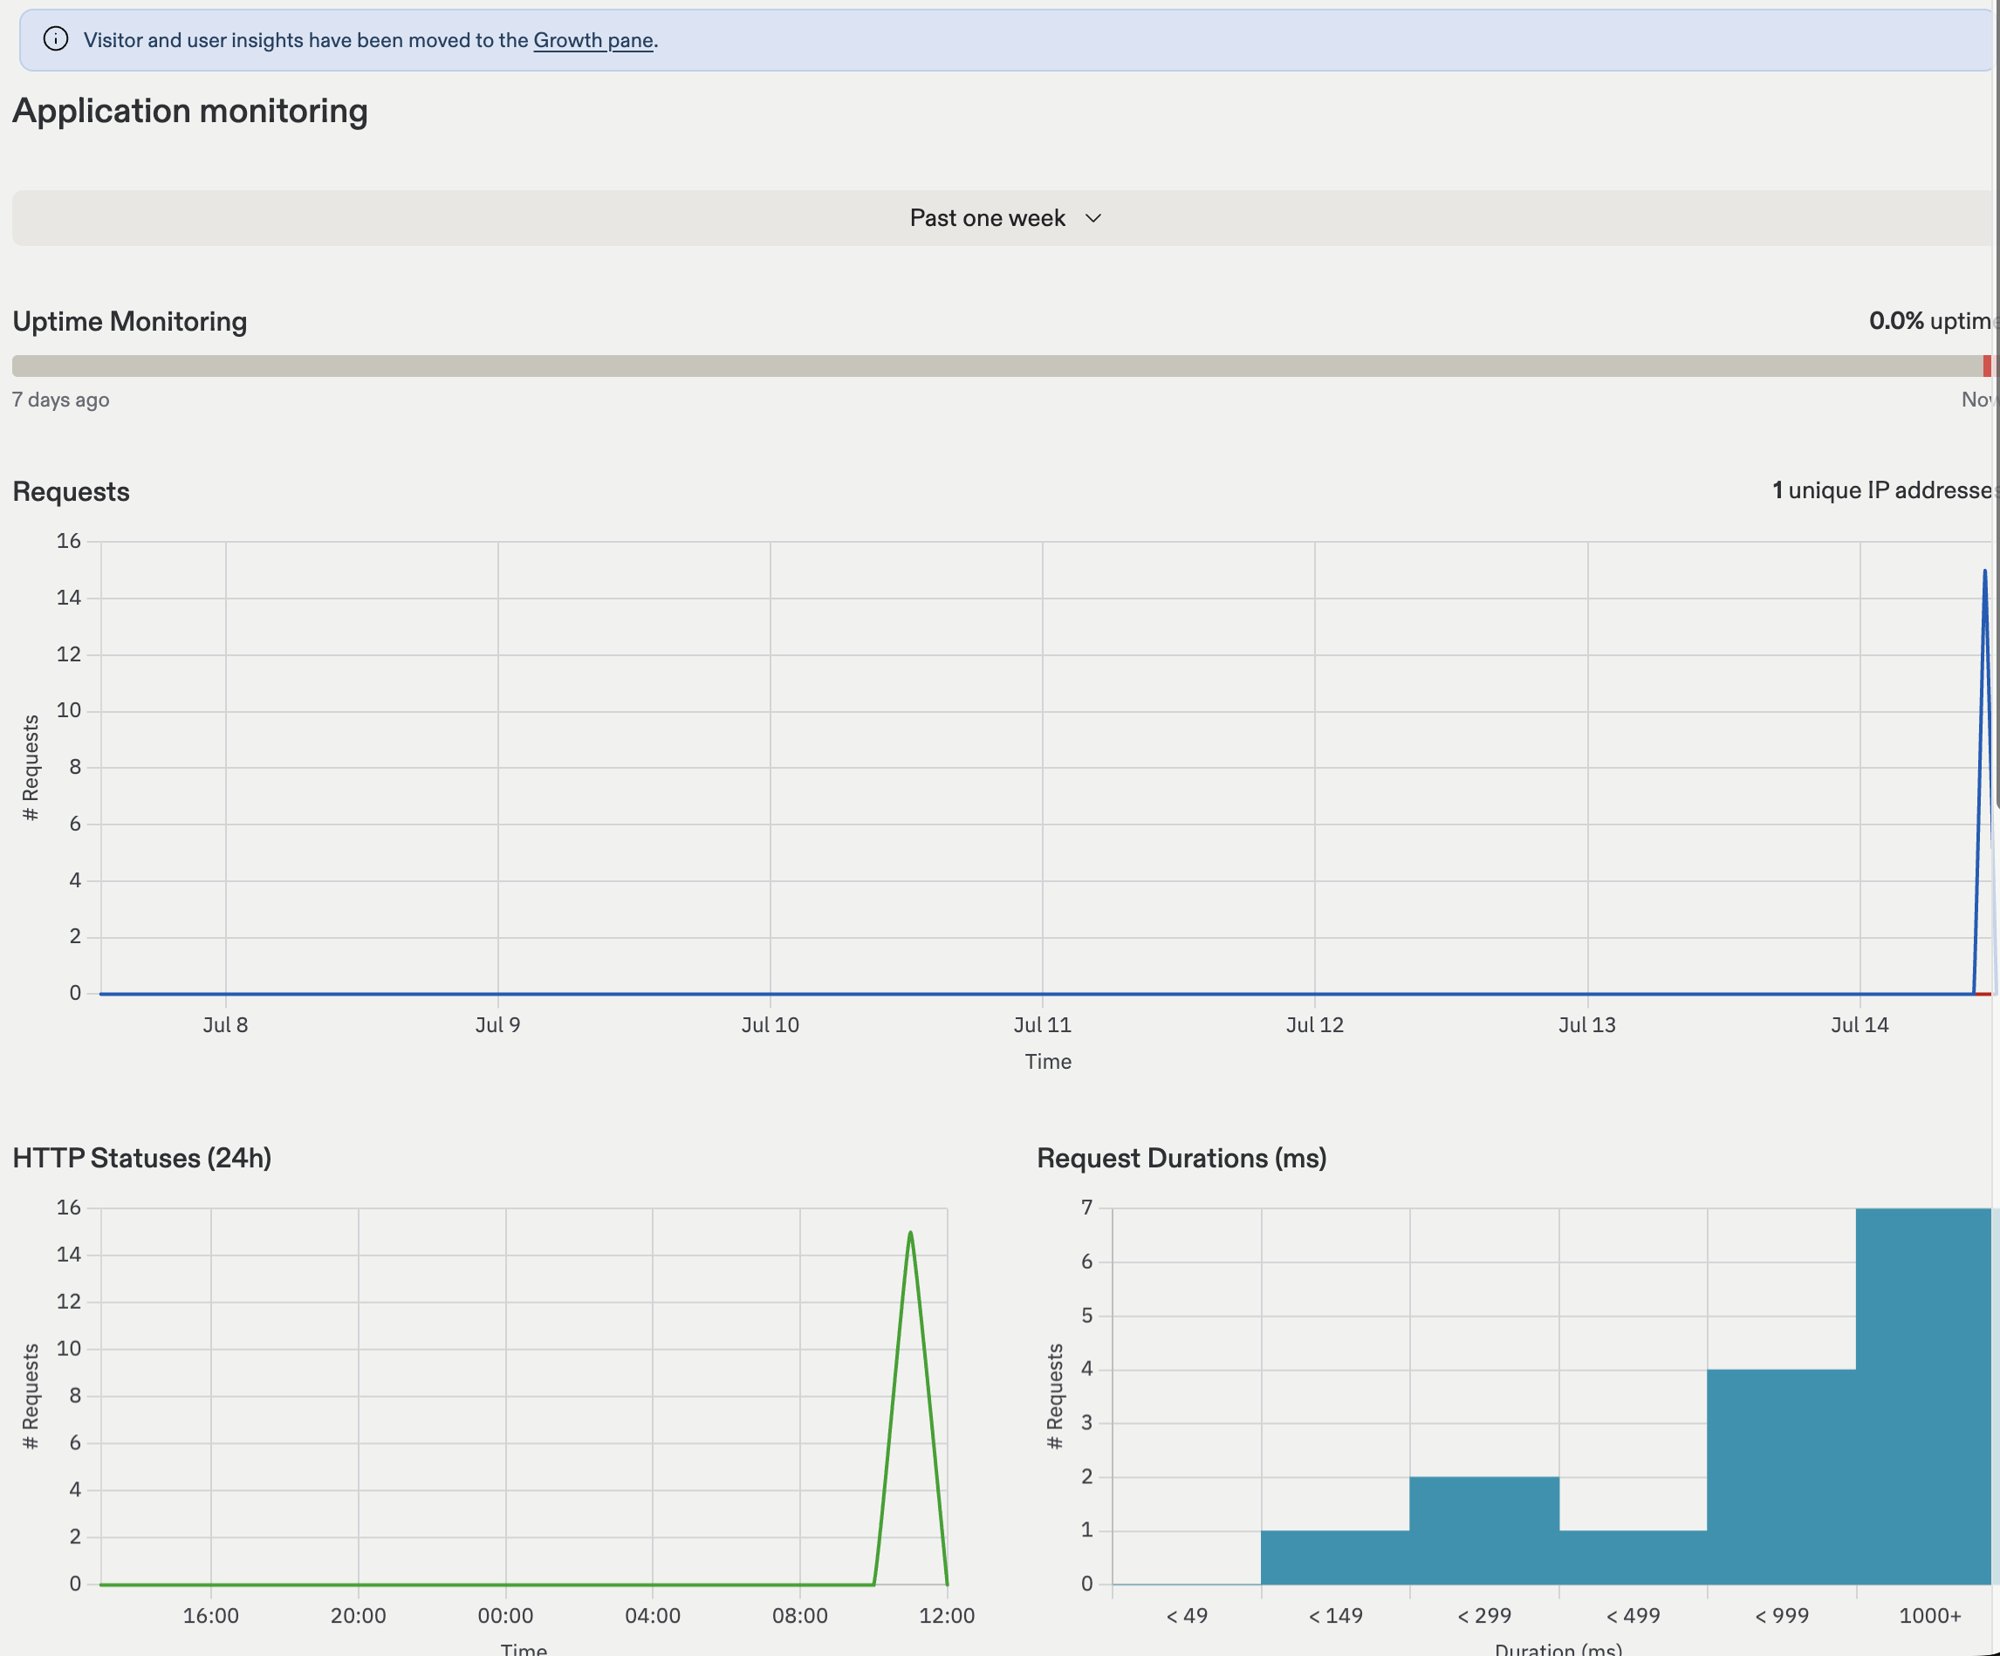
- Uptime Monitoring: Shows the percentage of time your app was online, with a colored bar for recent history. Replit checks your app on a regular schedule and emails you if it goes down.
- Requests: How much traffic your app is serving over time, along with the number of unique IP addresses reaching it.
- HTTP Statuses: How your app answered recent requests. Successful responses are healthy; a spike of errors is a sign to investigate. Paste an error spike’s timeframe into Agent chat and ask it to check the logs.
- Request Durations: How long your app takes to respond, grouped into buckets. If most requests land in the slowest buckets, your app may need attention or a more powerful machine.
Turn on uptime monitoring
Uptime checks are controlled from the publish settings.1
Open the publish settings
Open the Publishing tool and start a new publish or republish your app.
2
Enable the toggle
Under Monitoring tools, switch on Enable app monitoring, then publish your app.
3
View your uptime
After publishing, your uptime appears in the Monitoring tool within a few minutes.
Uptime monitoring is available on Replit Core, Pro, and Enterprise plans. It works for all deployment types except Scheduled Deployments, which don’t serve a web page.
Infrastructure monitoring
Infrastructure monitoring shows what your app is consuming behind the scenes.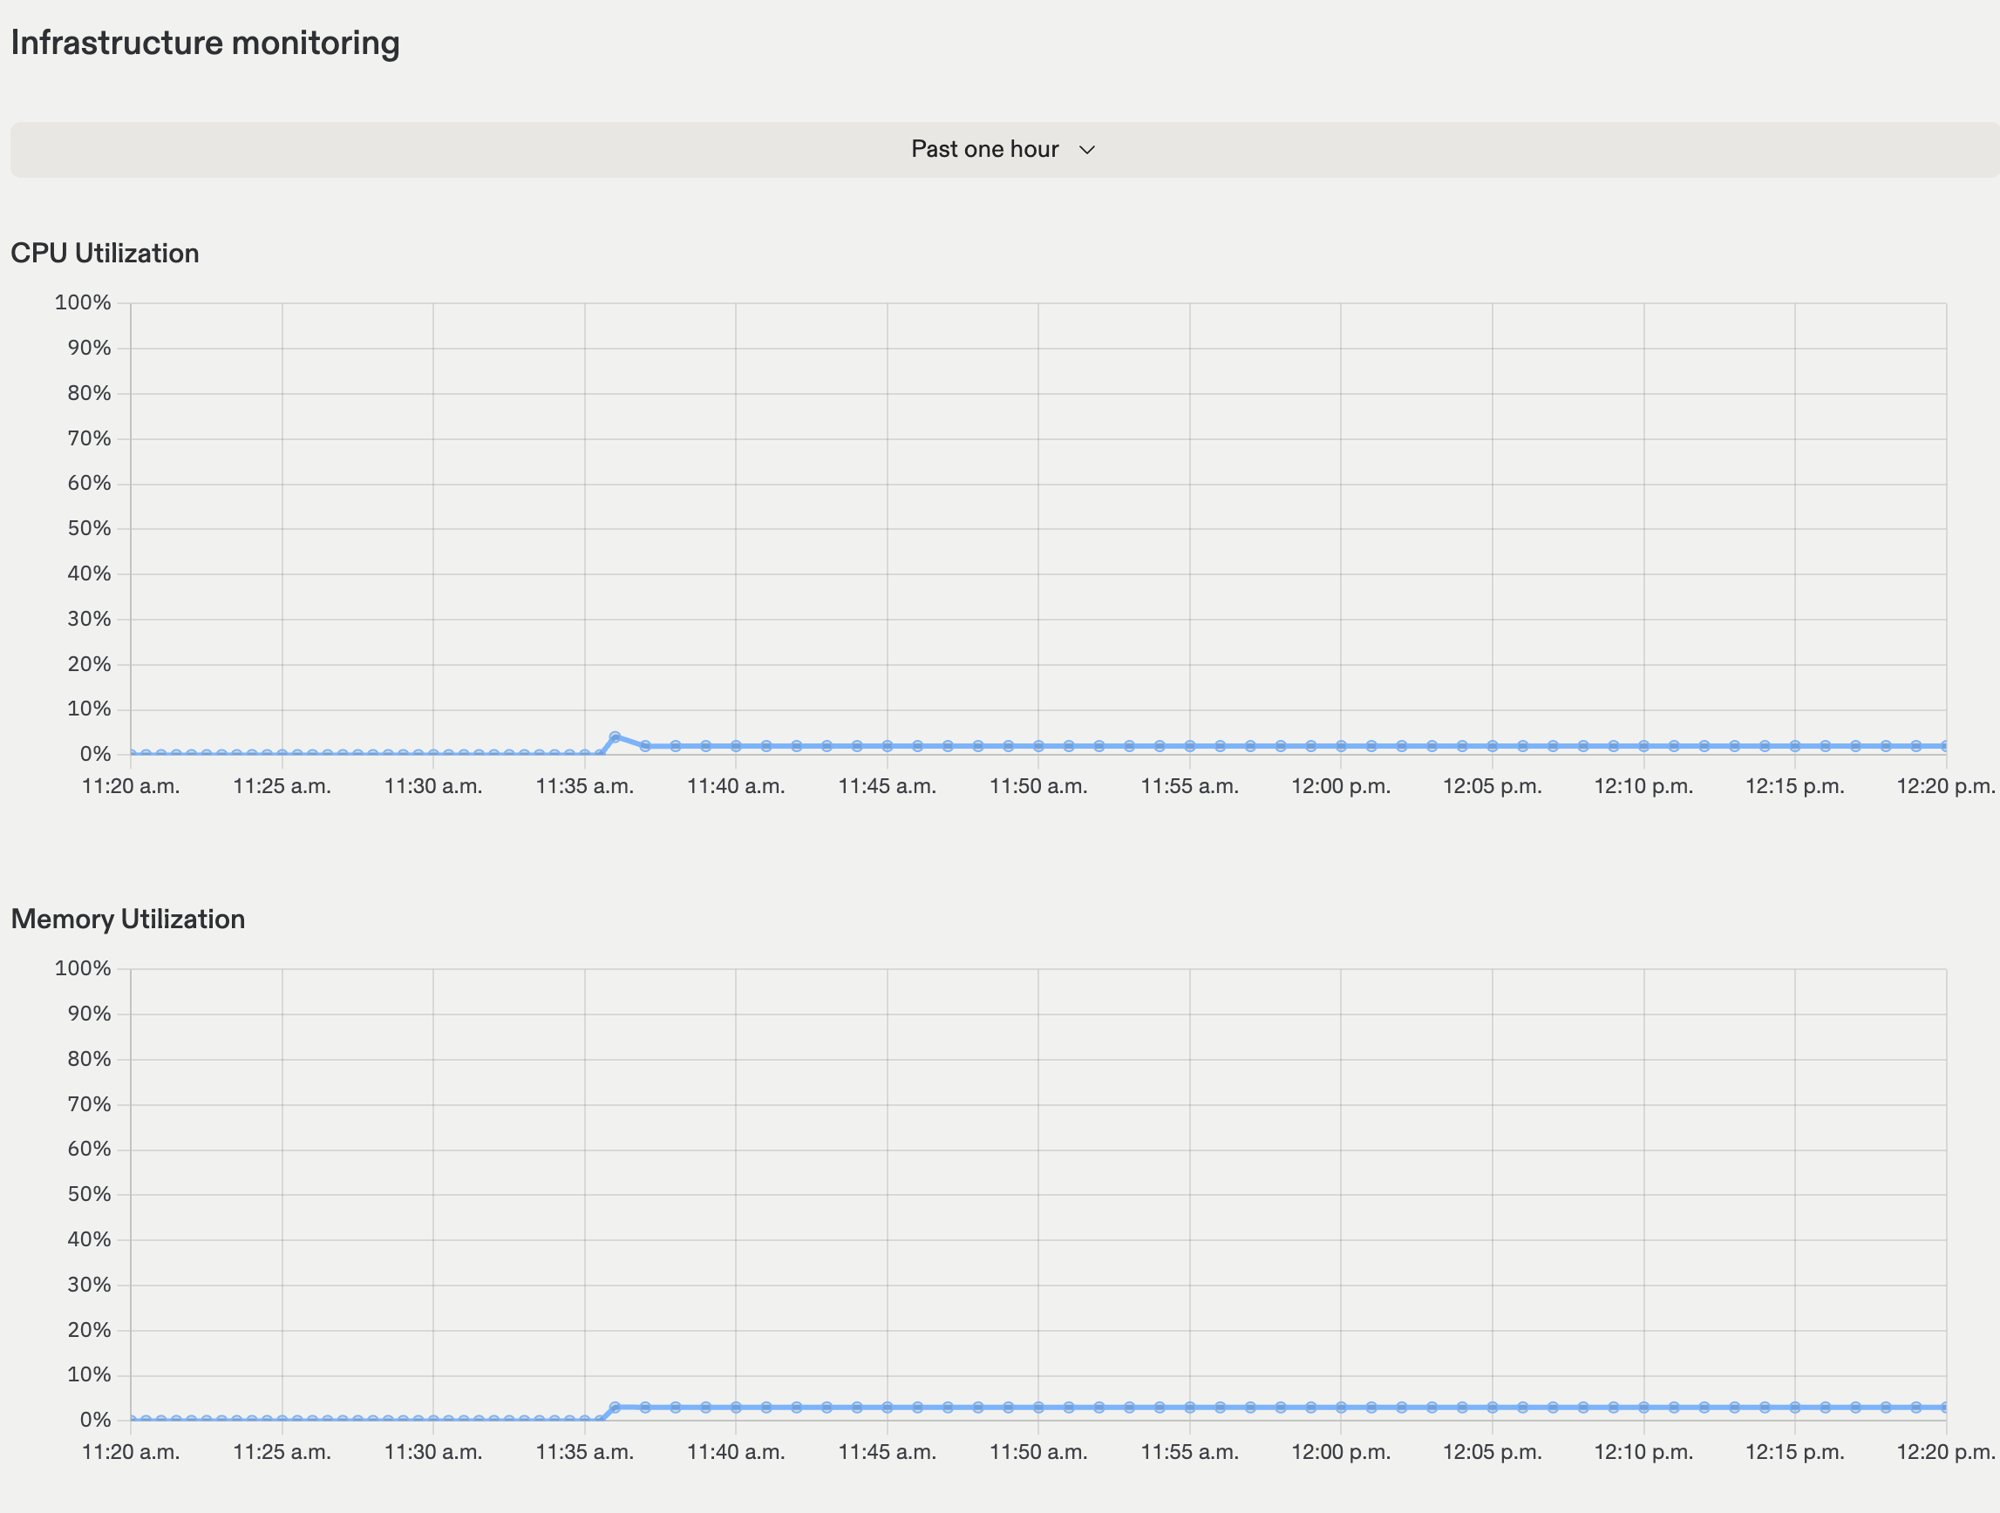
- CPU Utilization: How much processing power your app is using.
- Memory Utilization: How much memory your app is using.
Logs
Logs show what your app is doing in real time, including errors and messages your app prints while it runs. Replit retains deployment logs for 30 days. You can narrow down the logs with the following filters:- Errors only: View only error logs.
- Search: Enter a phrase to find in the logs.
- Date: Select a date range.
Next steps
- After you publish: What happens when your app goes live.
- Machine configuration: Give your app more power.
- Feedback widget: Hear from your visitors directly.